Featured Products
Light Spectrum Affects Maximum Rate of Carboxylation & Electron Transport
Many greenhouse operations use supplemental lighting to extend the growing season and increase crop yield. Electricity for lighting, however, can be expensive. It has been estimated that electricity associated with supplemental lighting can account for as much as 30% of operating costs (van Iersel and Gianino, 2017). With rapidly advancing technology, growers now have the option of light-emitting diode (LED) lighting to reduce the high electricity cost associated with supplemental lighting. LED lights generally have good efficacy, longevity, and controllability, and can provide narrow wavebands of light. This offers unique opportunities for growers to manipulate crop physiology by changing light spectrum and intensity. This requires a better understanding of the effects of light spectrum and intensity on crop photosynthesis, growth, and development.
Many commercially available growing lights use red and blue LEDs because of their high efficacy. Red and blue also represent peaks in the photosynthetic action spectrum, or McCree spectrum, and have the highest quantum yield of CO2 fixation across the whole light spectrum (McCree, 1971). Between these two lights, red lights have a higher quantum yield than blue light, meaning that crops can utilize red photons more efficiently (McCree, 1971). However, McCree collected his data at low PPFD and with one waveband at a time, ignoring potential interactions among photons with different wavelengths. There is compelling evidence that at higher PPFD, the efficacy of green light can be higher than that of red light (Terashima et al., 2009), while far-red light increases photosynthesis synergistically when combined with shorter wavelengths of light (Zhen and van Iersel, 2017). The effects of different spectra on crop growth and development are not limited to photosynthetic physiology, but can also affect crop morphology and secondary metabolism in a crop-specific manner (Ouzounis et al., 2015). The physiological reasons for spectral and crop-specific effects are not well understood.
To explore the underlying physiological mechanisms of responses to red and blue light, we constructed photosynthetic assimilation CO2 response (A/Ci) curves to quantify the photosynthetic characteristics of lettuce plants under both red and blue LED light. A/Ci curves quantify net photosynthetic rate (noted as A, assimilation) as a function of internal leaf CO2 concentration (noted as Ci).
The traditional method to construct A/Ci curves involves steady-state gas exchange measurement that exposes a plant to a certain light intensity and CO2 concentration until that plant reaches a steady physiological state, then moves on to the next CO2 concentration.
There are a few drawbacks to this method: 1) it takes a long time to collect a single A/Ci response curve, typically 30 minutes; 2) within that time frame, other biological responses may arise and complicate the interpretation (Stinziano et al., 2017). A recent technique, rapid A/Ci response (RACiR), addresses those limitations by taking non-steady-state measurements of gas exchange, which greatly accelerates the process (Stinziano et al., 2017). The RACiR technique requires rapid control of the CO2 concentration in the leaf cuvette and high temporal resolution but can complete an A/Ci response curve within minutes. Newer leaf gas exchange systems, like the CIRAS-3, have rapid response times, facilitating this new approach.
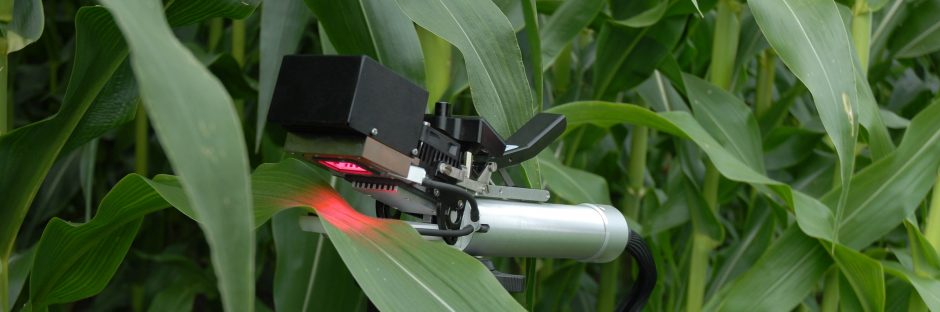
We constructed A/Ci curves on 3 lettuce plants under red and blue light at saturating PPFD (1,000 µmol/m2/s) provided by the LED light source in the leaf cuvette of the CIRAS-3 Portable Photosynthesis System. Although leaf absorptance of red and blue light can differ, using saturating PPFD assure that such absorptance differences do not skew the results. Each A/Ci response recorded 150 photosynthetic measurements at CO2 ranging from 3 to 950 µmol/mol inside the leaf cuvette and was completed in 6 minutes. Examples of A/Ci curves of lettuce are shown to the right.
Under red LED light, Vc,max of lettuce averaged 37.4 µmol/m2/s. Vc,max under blue LED light, 27.4 µmol/m2/s, was lower than that under red light. This implies that red light outperformed blue light at upregulating carboxylation activity of Rubisco. The maximum rate of electron transport (Jmax) under blue light (47.3 µmol/m2/s) also was lower than under red light (58.4 µmol/m2/s), as was triose phosphate utilization (4.16 and 3.30 µmol/m2/s under red and blue light, respectively).
According to the McCree action spectrum, red light has a higher quantum yield of CO2 fixation than blue light. This difference in quantum yield appears to be correlated with the carboxylation capacity of RubisCO, Jmax, and triose phosphate utilization. Counterintuitively, a possible explanation for this difference is that chlorophyll absorbs blue light more effectively than red light. This allows red light to penetrate into leaves more deeply. This can enhance electron transport in deeper cell layers, thus allowing more cells to contribute to leaf CO2 fixation. In addition, some of the blue light is absorbed by carotenoids and flavonoids that transfer harvested energy less efficiently to reaction centers than chlorophyll a and b do (Akimoto et al., 2005). This can further reduce Jmax under blue light. Also, several Calvin cycle enzymes require light for their activation and deeper light penetration into leaves may thus facilitate activation of Calvin cycle enzymes in more cells. Enhancing electron transport and Calvin cycle activity in deeper cell layers can enhance the overall photosynthetic capacity of leaves. This is consistent with the results from our rapid A/Ci curves.
Literature Cited:
Akimoto, S., M. Yokono, M. Ohmae, I. Yamazaki, A. Tanaka, M. Higuchi, T. Tsuchiya, H. Miyashita and M. Mimuro. 2005. Ultrafast Excitation Relaxation Dynamics of Lutein in Solution and in the Light-Harvesting Complexes Ii Isolated from Arabidopsis thaliana. The Journal of Physical Chemistry B. 109(25):12612-12619. doi:10.1021/jp050595q
McCree, K.J. 1971. The Action Spectrum, Absorptance and Quantum Yield of Photosynthesis in Crop Plants. Agricultural Meteorology. 9(Supplement C):191-216. doi.org/10.1016/0002-1571(71)90022-7
Ouzounis, T., E. Rosenqvist and C.-O. Ottosen. 2015. Spectral Effects of Artificial Light on Plant Physiology and Secondary Metabolism: A Review. HortScience. 50(8):1128-1135. doi.org/10.21273/HORTSCI.50.8.1128
Sharkey, T.D., C.J. Bernacchi, G.D. Farquhar and Singsaas, E.L. 2007. Fitting Photosynthetic Carbon Dioxide Response Curves for C3 Leaves. Plant, cell & environment. 30(9):1035-1040. doi:10.1111/j.1365-3040.2007.01710.x
Stinziano, J. R., Morgan, P. B., Lynch, D. J., Saathoff, A. J., McDermitt, D. K., and Hanson, D. T. 2017. The Rapid A–Ci Response: Photosynthesis in the Phenomic Era. Plant Cell & Environment, 40: 1256– 1262. doi: 10.1111/pce.12911.
van Iersel, M.W. and D. Gianino. 2017. An Adaptive Control Approach for Light-Emitting Diode Lights Can Reduce the Energy Costs of Supplemental Lighting in Greenhouses. HortScience. 52(1):72-77. doi: 10.21273/HORTSCI11385-16

Jun Liu, Ph.D. student under Dr. Marc van Iersel, working with far red LED light.

Figure 1. Relative quantum efficiency curve.
(Adapted by Marc van Iersel from McCree (1971))

Figure 2. Examples of A/Ci curve measured lettuce leaf under light of 1000 µmol/m2/s


Figure 3. Curve fitting for A/Ci curves under red and blue LEDs using the method developed by Sharkey et al. (2007). Blue dots represent averaged assimilation (µmol/m2/s) measured by CIRAS-3. Red lines represent the limitation imposed by Rubisco carboxylation activity when CO2 supply was low. Green lines represent the limitation imposed by electron transport rates as CO2 concentration increased. Yellow lines represent limitation imposed by rate of triose phosphate utilization, i.e. the formation rate of end-product of Calvin cycle. Figure 3A and B show the fitted A/Ci curves for lettuce plants under red and blue LED light, respectively.

Jun Liu, Ph.D. student under Dr. Marc van Iersel, taking photosynthetic measurement with the CIRAS-3 Portable Photosynthesis System.
PP Systems would like to thank and acknowledge Jun Liu and Dr. Marc van Iersel for providing the information contained in this application note.
Learn more about Dr. van Iersel’s work:
Learn More
Measuring CO2 Efflux From Sedimentary Rocks
The concentration of carbon dioxide (CO2) in the atmosphere controls Earth’s climate. Sedimentary rocks act as a giant geologic reservoir of carbon that can exchange CO2 with the atmosphere. Carbon in rocks is stored in the form of organic matter (e.g. ancient plant remains) and carbonate minerals (e.g., calcite or CaCO3). Erosion can act to expose sedimentary rocks to oxygen in the atmosphere, and this can lead to weathering and: i) oxidation of the sedimentary organic matter that produces CO2; ii) oxidation of sulfide minerals (e.g., pyrite) that produces sulfuric acid which ultimately dissolves carbonate minerals and produces CO2. In other words, when sedimentary rocks are exposed to the atmosphere, they can release CO2 that has been locked away for millions of years. We know that this process is slow compared to human emissions of CO2 from burning fossil fuels. However, it is likely to be a major player in the natural carbon cycle and influences atmospheric CO2 over thousands to millions of years.
Despite this recognition, this CO2 efflux is not well constrained, mainly due to a lack of measurements of how fast this occurs and how the flux varies in space and time. The CO2 efflux from the weathering of sedimentary rocks is generally estimated indirectly – for instance by measuring the products of reactions found dissolved in river water [1]. Until now, no direct measurements of this CO2 efflux exist.
In order to measure the sedimentary rock CO2 efflux in situ, Robert G. Hilton and Guillaume Soulet (Department of Geography, Durham University, UK) and Mark H. Garnett (Natural Environment Research Council, NERC, Radiocarbon Facility, East Kilbride, UK) have designed a new approach. The research is funded by the ROC-CO2 project funded by a European Research Council Starting Grant and supported by the OZCAR-RI Draix-Bléone Observatory in France. The team has designed a chamber method [2] coupled to the molecular sieve sampling system (MS3) designed in ref. [3] and using the EGM-5 Portable CO2 Gas Analyzer from PP Systems. The chamber is drilled directly into the rock face that is undergoing weathering, and sealed using PVC tube, rubber bung and a series of glass tubes and Tygon® tubing. This enables the operators to connect the chamber to the CO2 sampling system (MS3) through the EGM-5 Portable CO2 Gas Analyzer (Figures 1A, 1B & 2). The chamber dimensions, typically 40 cm deep and 3 cm in diameter, were designed so that the chamber internal area to volume ratio is high, benefiting CO2 flux measurements.
Chambers are stable and can stay in field for several months or years making it possible to monitor possible changes in the CO2 efflux over seasonal cycles. The design takes advantage of the MS3 system [3] that enables the operator to trap the CO2 actively through molecular zeolite sieves while measuring the CO2 flux. This is a key development, as the combination of radiocarbon (14C) and the stable carbon (12C and 13C) isotopic composition of the sampled CO2 are needed to partition the measured CO2 flux into its two components: the CO2 flux from sedimentary organic matter oxidation and the CO2 flux from the carbonate dissolution by sulfuric acid [2].
Here an example is shown of a chamber and EGM-5 in use on March 27th 2017, when a series of CO2 flux measurements were performed while trapping CO2 (Figure 3A) for isotopic measurements back in the lab. Resulting CO2 fluxes were high (~730 mgC/m2/day) (Figure 3B-C). Isotopic measurements made later showed that 75% of this flux originated from the dissolution of carbonate by sulfuric acid, and that the remaining 25% was from the rock organic matter oxidation [2]. Based on this new method, Robert Hilton, Guillaume Soulet, and the ROC-CO2 team are deploying these chambers in other locations with different rock types, while also monitoring the CO2 flux regularly through the year to assess the temporal variability of CO2 fluxes to be determined. Together, these data will help to improve our understanding of how the oxidative weathering of rocks impacts the carbon cycle in the geological past, the present and into the future.

Figure 3A. pCO2 trace acquired using the EGM-5 Portable CO2 Gas Analyzer from PP Systems and the CO2 monitoring-sampling system [3] over a ~3-hour time period. The pCO2 increases occur when CO2 is building up in the rock chamber, whereas the sharp pCO2 decreases are when the CO2 is trapped from the rock chamber into a zeolite sampler [2]. Grey area show the fitting window to calculate the CO2 flux from the raw pCO2 trace (please see further details in ref. [2]).

Figure 3B-C. Calculated fluxes over the monitoring period. CO2 flux estimates were relatively high with an average of ~730 mgC/m2/day.

Figure 1A. EGM-5 Portable CO2 Gas Analyzer connected to a chamber drilled in the rock face [2], through the MS3 monitoring-sampling system [3], while we measure CO2 efflux from sedimentary rock in the Laval stream catchment, Draix, France. (© R. Hilton)

Figure 1B. Equipment setup in the Waiapu River catchment, New Zealand. (© R. Hilton)

Figure 2. An example of the new method (EGM-5 Portable CO2 Gas Analyzer connected to a chamber drilled in the rock face [2], through the MS3 monitoring-sampling system [3]) being used in the Waiapu River catchment, New Zealand. (© R. Hilton)
PP Systems would like to thank and acknowledge Robert G. Hilton and Guillaume Soulet, (Durham University, Durham DH1 3LE, United Kingdom) for providing the information contained in this application note.
Learn more about the ROC-CO2 project.
Learn More
Soil Carbon Fluxes & Estimation of Carbon Balance
Soil carbon storage represents a huge potential risk for exacerbating climate change but also a large opportunity to mitigate climate change. Soils store over three times the amount of carbon that is currently in our atmosphere. As soils warm due to climate change, microbial metabolic rates will increase, increasing soil carbon decomposition and releasing CO2 into the atmosphere—a positive feedback to climate change. However, if organic matter inputs to soils increase, either due to increased plant growth or better soil management, soils may actively sequester carbon from the atmosphere. The balance of these two processes will determine whether soils will become a net source of carbon, exacerbating climate change, or a net sink, helping to mitigate climate change. Accurate data on soil respiration rates are needed to determine carbon losses from the soil to calculate soil carbon balance.

This CFLUX-1 automatically recorded soil respiration measurements every hour from June through November (2018) in an old field ecosystem at the Dartmouth College organic farm. (Photo credit: Caitlin Hicks Pries)
Dr. Caitlin Hicks Pries of Dartmouth College used a set of four CFLUX-1 Automated Soil CO2 Flux Systems throughout the summer and fall of 2018 to measure soil respiration rates from an old field ecosystem that was previously used for agriculture. The soils at this site have lost up to 60% of their soil carbon stocks due to hundreds of years of farming, plowing, and grazing. These degraded soils represent an opportunity to increase soil carbon storage through compost additions. However, it is unclear whether efforts to increase soil carbon storage will be thwarted by increased decomposition rates due to warmer temperatures. Dr. Hicks Pries used the CFLUX-1 Automated Soil CO2 Flux Systems to gather baseline data in 2018 before beginning experimental treatments in 2019.
Throughout four months of hourly data collection, the CFLUX-1s collected over 10,000 soil respiration fluxes (Fig. 1). These data were collected with a minimum of maintenance effort. The lab basically checked on the chambers using their Wi-Fi connection every two weeks and changed absorbent columns every six weeks. These data were used to investigate how seasonality, soil temperature, and soil moisture affected soil respiration rates. As shown below, soil respiration rates increased with temperature to about 25 °C (Fig. 2). Above 25 °C, soil respiration rates were dependent on soil moisture (Fig. 3). Using these data, Dr. Hicks Pries and her students will develop empirical models to estimate soil respiration throughout the year based on soil temperature and moisture.

Figure 3. Unlike with soil temperature, there were no obvious overall trends between soil respiration and soil moisture (volumetric water content measured with the HydraProbe; right). However, when temperatures were >25 °C, there was a strong positive correlation between soil respiration and soil moisture.
The Hicks Pries lab will use an empirical model based on the CFLUX-1 data to estimate annual soil respiration losses. Combined with estimates of carbon uptake from the biomass of annual plants, the Hicks Pries lab will be able to estimate the carbon balance of their old field ecosystem. Once their compost addition by warming experiment begins, they will be able to compare these baseline data with the treatment effects. The CFLUX-1 Automated Soil CO2 Flux Systems and Stevens HydraProbes will continue to provide valuable data during the experiment.

Figure 1. Soil respiration data collected with the four CFLUX-1 systems over the summer and early fall of 2018. Seasonal patterns are evident in the data showing decreasing soil respiration in September and October.

Figure 2. Soil respiration rates increased with soil temperature (measured using the Stevens HydraProbe) as expected in all plots. We will use these data to fit various models of temperature sensitivity.
Dr. Hicks Pries would like to thank Owen Krol and Tanner Aiono for assistance in the field.
PP Systems would like to thank and acknowledge Dr. Caitlin Hicks Pries for providing the information contained in this application note.
Learn more about Dr. Pries and the Hicks Pries Lab.
Learn More
Physiology and Vascular Anatomy of Different Avocado Genotypes Relative to Laurel Wilt Susceptibility
Laurel wilt, caused by the fungus Raffaelea lauricola, and carried by bark beetles, is a serious plant disease that has decimated members of the Lauraceae plant family in the southeastern United States since the early 2000s when it was first detected in the US. Originally found infecting forest trees, it was observed in a commercial avocado orchard in Florida in 2012, and now poses a grave threat to Florida’s avocado industry. Infected trees wilt and usually die due to plugging of the vascular system. The disease has spread as far west as Texas and could pose a huge threat to the multi-billion dollar avocado industries of California and Mexico if it spreads to those areas.
Laurel wilt has become such serious concern that a large multi-state, interdisciplinary project, funded by a USDA Specialty Crops Grant is underway to help find a solution to the disease. One of the components of this project being investigated by Drs. Bruce Schaffer and Randy Ploetz, PhD student Raiza Castillo and Biologists Ana Vargas, Josh Konkol, Aime Vazquez, and Randy Fernandez, and collaborator Dr. Ed Etxeberria at the University of Florida, Citrus Research and Education Center, is to determine the relative susceptibility of different avocado races and scion/rootstock combinations in relation to differences in avocado tree physiology and vascular anatomy.
The avocado species, Persea americana, is divided into three botanical races, Mexican (M), Guatemalan (G) and West Indian (WI). In Florida, all commercial avocado scions are grafted on seedling WI cultivars, primarily ‘Waldin’. Commercially available clonal rootstocks (M and G) developed in California and elsewhere, not currently used in Florida, are being tested and compared with clonally propagated material of the seedling WI rootstocks currently used in Florida for their resistance to laurel wilt.
Physiological attributes of different avocado genotypes are being tested to identify tolerance to the laurel wilt. Prior work with commercial cultivars indicated that G and MxG hybrid cultivars were significantly more tolerant to laurel wilt than WI cultivars (Ploetz et al., 2012). The relationship between differences in laurel wilt susceptibility to host physiology among different avocado cultivars was recently investigated (Ploetz et al., 2015; Schaffer et al., 2014). Prior to inoculation, significantly higher xylem sap flow rates were observed in the most susceptible cultivar, ‘Russell’ (WI), but after inoculation sap flow rates were significantly reduced in ‘Russell’ relative to ‘Marcus Pumpkin’ (G) or ‘Brogdon’ (MxGxWI hybrid). Net CO2 assimilation (A), stomatal conductance of H2O (gs) and transpiration (E) determined CIRAS-2 and CIRAS-3 portable gas exchange systems have been determined to be excellent non-destructive measures for disease-induced stress (Ploetz et al., 2013; Schaffer et al., 2014). Also, scanning electron microscopy is being used to assess xylem anatomy as it relates to tree physiology and disease susceptibility in avocado genotypes being evaluated.
The impacts of clonal rootstocks and root/stock scion combinations of different botanical races of avocado on the development of laurel wilts disease and the relationship between disease development and the xylem physiology and anatomy are being evaluated. From these studies, Information is being obtained about the relative susceptibility of different avocado races and influence of physiological variables on relative to disease susceptibility. This should lead to the identification of avocado rootstocks and/or the development rootstock/scion combinations that are resistant to laurel wilt disease.
References:
Ploetz, R. C., Pérez-Martínez, J. M., Smith, J. A., Hughes, M. C., Dreaden, T. J., Yu, Y., and Inch, S. 2012. Responses of avocado to laurel wilt, caused by Raffeala lauricola. Plant Pathology 61:801-808.
Ploetz, R.C., Schaffer, B., Vargas, A.I.. Konkol, J.L., Salvatierra, J., Inch, S.A., Campbell, A. and Wideman, R. 2013. Physiological impacts of laurel wilt on avocado. Phytopathology 103(S):114 (abstract).
Ploetz, R.C., B. Schaffer, A.I. Vargas, J.L. Konkol, J. Salvatierra and R. Wideman. 2015. Impact of laurel wilt, caused by Raffaela lauricola, on leaf gas exchange and xylem sap flow of avocado, Persea americana. Phytophathology 105:433-440.
Schaffer, B., Ploetz, R.C., Vargas, A.I., Konkol, J. and Salvatierra, J. 2013. Laurel wilt differentially affects xylem sap flow of three avocado cultivars. HortScience 48:S322 (abstract).
We would like to thank Dr. Bruce Schaffer (University of Florida-TREC) and Dr. Randy Ploetz (University of Florida-TREC) and their graduate students for providing the content contained in this application note.
Click here for more information on the CIRAS-3 Portable Photosynthesis System.
If you would like to learn more about this exciting research, please contact PP Systems.

Raiza Castillo (University of Florida – Tropical Research & Education Center – Homestead, FL) performing measurements of leaf gas exchange and chlorophyll fluorescence using the CIRAS-3 Portable Photosynthesis System

Net CO2 assimilation (A) and external severity of laurel wilt on ‘Brogdon,’ ‘Marcus Pumpkin’ and ‘Russell’ avocado trees before (-day) and after (+days) inoculation with Raffaelea lauricola. Different upper case letters indicate significant differences in A among cultivars and different lower case letters indicate significant differences in disease severity among cultivars. From Phytopathology 2015, 105:433-440.
Learn More
Studying Volcanic Activity Using Drones and Sensors to Accurately and Precisely Predict Volcanic Explosive Eruptions
A team of research scientists from McGill University (Montreal, Quebec CANADA), Universidad de Costa Rica (San Jose, Costa Rica), and the Observatorio Vulcanológico y Sismológico de Costa Rica (Heredia, Costa Rica) are currently developing a series of drones and associated instrumentation to study Turrialba volcano in Costa Rica. This volcano has shown increasing activity during the last 20 years, and the volcano is currently in a state of heightened unrest as exemplified by recent explosive activity in May-August 2016. The eruptive activity has made the summit area inaccessible to normal gas monitoring activities, prompting development of new techniques to measure gas compositions. The team has been using two drones, a DJI Spreading Wings S1000 octocopter and a Turbo Ace Matrix-i quadcopter, to airlift a series of instruments to measure volcanic gases in the plume of the volcano.
These instruments comprise optical and electrochemical sensors to measure CO2 (SBA-5 CO2 Gas Analyzer – PP Systems), SO2, and H2S concentrations which are considered the most significant species to help forecast explosive eruptions and determine the relative proportions of magmatic and hydrothermal components in the volcanic gas. The integrated payloads weigh 1-2 kg, which can typically be flown by the drones in 10-20 minutes at altitudes of 2000-4000 meters. Our broader goals are to map gases in detail with the drones in order to make flux measurements.
MINIGAS – Developed at the Universidad de Costa Rica, this compact instrument measures CO2, SO2, and H2S , as well as GPS location, pressure, temperature, and humidity. Data are stored on data loggers and can also be transmitted by telemetry. Total weight is 1.2 kg.
MICROGAS – Developed at McGill University, this instrument measures CO2, H2O, SO2, and H2S. The CO2-H2O infrared sensor is made by PP Systems, while the SO2 and H2S electrochemical sensors are made by City Technology. Data are recorded on Grant Yoyo dataloggers. The entire package including battery weighs 1.14 kilograms.
We now have the means to forecast explosive eruptions. The key information that is gathered includes gas, seismic, and geodetic data which indicate (a) overpressure and (b) open system behavior. See Examples 1 through 4.
References:
Example 1: From: De Moor et al. 2016, J. Geophys. Res. 121, 5761-5775
Example 2: From: Narváez M. et al. 1997, J. Volcanol. Geotherm. Res. 77, 159-171; Gómez M. and Torres C., 1997, J. Volcanol. Geotherm. Res. 77, 173-193
Example 3: From: Martinelli 1990, J. Volcanol. Geotherm. Res. 41, 297-314
Example 4: From: Druitt et al. 2002, Geol. Soc. London Mem. 21, 281-306
PP Systems would like to thank and acknowledge (left to right) Ernesto Corrales (GAS Lab, CICANM-Univ. de Costa Rica), Fiona D. D’Arcy (McGill University, Montreal, QC Canada), Maarten J. de Moor (Observatorio Vulcanológico y Sismológico de Costa Rica, Heredia, Costa Rica), Dr. John Stix (McGill University, Montreal, QC Canada), Alfredo Alan (GAS Lab, CICANM-Univ. de Costa Rica), and Dr. Jorge Andres Diaz (GAS Lab, CICANM-Univ. de Costa Rica) (not shown) and for providing the information contained in this application note.

Learn more about McGill University Earth and Planetary Sciences Department Volcanology Research Group here. Follow them on Facebook.
Click here for more information on the SBA-5. If you would like to learn more about this exciting research, please contact PP Systems.
For application notes on PP Systems’ products, click Application Notes.


SBA-5 CO2 Gas Analyzer including H2O sensor, pump and enclosure.

Example 1. Turrialba 2014-2015 (Costa Rica): CO2/sulfur ratio increases substantially prior to explosive eruptions and ash emissions

Example 2. Galeras 1993 (Colombia): Monochromatic seismic signals (“tornillos”) systematically increase in number and duration, and decrease in dominant frequency, prior to explosive eruptions.

Example 3. Nevado del Ruiz 1985 (Colombia): Banded tremor on 7 September, 4 days prior to ash emission on 11 September. Each tremor cycle is 15-20 minutes’ duration.

Example 4. Soufrière Hills volcano, 1997 (Montserrat): Inflation cycles shown in (a), RSAM in (b). Peaks in tilt and RSAM correspond to vulcanian eruptions. Note the ~12-hour cyclicity from 4 to 9 July.
Learn More
Measuring Soil CO2 Efflux from Ant Nests in the Brazilian Rainforest
A common assertion is that tropical forests (especially tropical wet forests) are more productive than temperate forests, and on an annual basis, rates of net primary productivity (NPP: carbon fixed per unit area per year) of tropical wet forests greatly exceed rates of NPP in temperate deciduous or coniferous forests. Yet, on shorter time scales (daily or monthly), NPP of temperate forests is about equal to that of NPP of tropical forests, and “ecologically relevant” productivity is thought to be highest in latitudes between 30° and 50° [1]. Comparable data for organisms at other trophic levels, however, are scant; for example, the carbon flux rate from soils (i.e., “soil respiration”) is a crucial part of any terrestrial ecosystem model, but values for soil respiration used in ecosystem models include only soil microbes and plant roots. Although soil respiration of ant nests rarely has been measured in the field [2], nests of red wood ants (Formica rufa group) in northern Europe have respiration rates nearly five times higher than that of surrounding ant-free soils [3]. How this compares to tropical ants is unknown, but extrapolation from temperate studies suggests that contribution of ants to carbon cycling in tropical ecosystems could be quite large.
With support from the Museo Paraense Emílio Goelde in Belém, Brazil, Drs. Aaron M. Ellison (Harvard University, Harvard Forest) and Rogério R. Silva did a pilot study of CO2 efflux from ant nests at the Caxiuanã National Forest, Pará, Brazil. Instantaneous rates of soil carbon efflux from nests of five species of ground-nesting and arboreal-nesting ants and nearby soils lacking ants were measured for CO2 with an EGM-5 Portable CO2 Gas Analyzer and an SRC-2 Soil Respiration Chamber.
CO2 efflux rates from ant-free soils (mean = 1.3 µmol CO2 m-2 s-1) and from nests of the ground-nesting Mycoperus and Pheidole spp. were lower than those measured previously during the dry season at Caxiuanã (≈3 µmol CO2 m-2 s-1) [4], but efflux rates of both leaf-cutter ants (Atta sp.) and fire ants (Solenopsis sp.) were substantially higher than background (ant-free) levels. CO2 efflux from nests of the arboreal nesting Odontomachus species also were comparable to ant-free soils. Future work will include more extensive measurements of these and other ant species, adjacent ant-free soils, and large arboreal nests of Azteca species. Together, these data will help to improve estimates of soil CO2 fluxes from tropical forests.
References:
[1] Huston, M. A., and S. Wolverton. 2009. The global distribution of net primary production: resolving the paradox. Ecological Monographs 79: 343-377.
[2] Peakin, G. J., and G. Josens. 1978. Respiration and energy flow. Pages 111-163 in M. V. Brian, editor. Production Ecology of Ants and Termites. Cambridge University Press.
[3] Jílková, V., T. Cajthaml, and J. Frouz. 2015. Respiration in wood ant (Formica aquilonia) nests as affected by altitudinal and seasonal changes in temperature. Soil Biology and Biochemistry 86: 50-57.
[4] Sotta, E. D., E. Veldkamp, B. R. Guimarães, R. K. Paixão, M. L. P. Ruivo, and S. S. Almeida. 2006. Landscape and climatic controls on spatial and temporal variation in soil CO2 efflux in an Eastern Amazonian rainforest, Caxiuanã, Brazil. Forest Ecology and Management 237: 57-64.
PP Systems would like to thank and acknowledge Aaron M. Ellison, (Harvard University, Harvard Forest, Petersham MA, USA) for providing the information contained in this application note.
If you would like to learn more about this exciting research, please contact PP Systems.
Follow Aaron M. Ellison: The unBalanced ecoLOGist

Figure. Estimates of CO2 efflux from ant nests at Caxiuanã and ant-free soils (“0 Control”). Box plots illustrate medians, quartiles, and upper and lower deciles; widths of the boxes are proportional to sample size, and points denote values of individual observations taken in the morning (red), mid-day (green), and afternoon (blue).

EGM-5 Portable CO2 Gas Analyzer and SRC-2 Soil Respiration Chamber on a Solenopsis nest at the Caxiuanã field station.

Custom collar on a Mycocepurus nest in the lab compound at the Caxiuanã field station.

Aaron Ellison (left) and Rogério Silva (right) measuring CO2 efflux from a Solenopsis nest at Caxiuanã.
Learn More
Measurement of CO2 from the Space Needle in Seattle, WA
On February 15, 2010, NOAA’s Pacific Marine Environmental Laboratory in collaboration with the Pacific Science Center and Seattle’s Space Needle, installed the WMA-4 CO2 Gas Analyzer to measure how much CO2 is in the air over Seattle, Washington (USA). There are two air intakes located on the space Needle. The lower intake is located 300 feet above street level, and the upper intake is located at the very top of the needle. These intakes bring the air through the tubes into the shack at the top of the needle. To learn more, click on http://www.pmel.noaa.gov/co2/story/Space+Needle and click on The Method over to the left for more specifics on the WMA-4 deployment and sampling. Thank you to Dr. Christopher Sabine (NOAA/PMEL) and his colleagues for the pictures and reports from Seattle.
If you would like to learn more about this exciting research, please contact PP Systems.

Measuring CO2 in Hospitals in Chicago, Illinois (USA)
Measuring CO2 in Hospitals in Chicago, Illinois (USA)
The SBA-5 CO2 Gas Analyzer is assisting researchers in Chicago, IL that are measuring a variety of building science parameters including CO2 that may ultimately be used to explain some of the differences in microbial communities observed inside a new hospital as it becomes occupied and operated for an entire year. To learn more about this exciting project, click on our Application Note or visit the Hospital Microbiome Project directly. To review the publication associated with this article, click here.
Thank you to Dr. Brent Stephens ( Illinois Institute of Technology, Dept. of Civil, Architectural and Environmental Engineering) for the pictures and information contained in this application note.
Click here for more information on the SBA-5. If you would like to learn more about this exciting research, please contact PP Systems.
For application notes on PP Systems’ products, click Application Notes.