Pulse modulated & continuous excitation systems
Chlorophyll Fluorescence
What is chlorophyll fluorescence?
The capacity of a plant to carry out photochemistry is limited and will depend upon a range of factors including stresses caused by environmental conditions. Absorbed light energy in excess of that used for photochemistry must be effectively dissipated by non-photochemical processes. Such processes include the emission of heat and re-emission of small but diagnostically significant amounts of the absorbed radiation as longer wavelength red/far-red light energy. This re-emission of light is termed chlorophyll fluorescence.
More
Although chlorophyll fluorescence emission from whole leaf systems is too weak to be viewed with the naked eye, it can be observed from illuminated extracts of a chlorophyll solution. Peak chlorophyll fluorescence occurs in the red region of the spectrum (685 nm) and extends into the infra-red region to around 800 nm.
Each of these processes operates in direct competition for a finite pool of absorbed energy, any change in energy utilization by one process produces a complementary change in the others. This fact enables chlorophyll fluorescence to be used as a rapid and reliable non-invasive probe of photochemistry. Specialist equipment is required for the analysis of the chlorophyll fluorescence signature. A Chlorophyll Fluorometer is designed specifically to detect the chlorophyll fluorescence emission from a sample. There are several different types of chlorophyll fluorometers available.
Hansatech Instruments designs and manufactures chlorophyll fluorometers based on 2 different measurement techniques: Continuous Excitation or Prompt Chlorophyll Fluorometers and Pulse Modulated Chlorophyll Fluorometers. These chlorophyll fluorometers cover a wide range of applications in photosynthesis research programs.
Continuous Excitation Systems
What are continuous excitation or prompt chlorophyll fluorimeters?
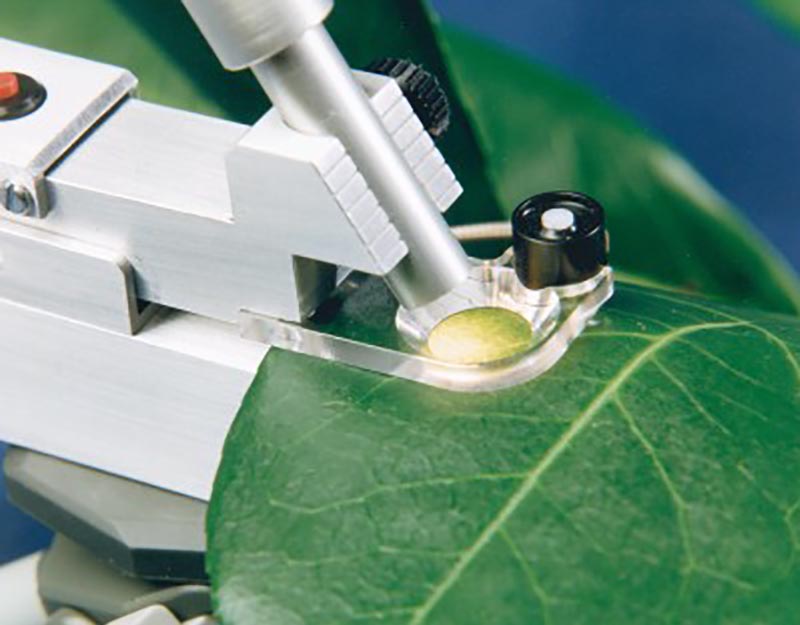
A continuous excitation fluorimeter is designed to measure the Kautsky Induction or Fast Chlorophyll Fluorescence Induction (Kautsky and Hirsch, 1931*). The systems use focused, high-intensity light from red LEDs to induce a fast chlorophyll fluorescence response from a dark-adapted sample. Continuous systems require the use of a special leafclip system. This is a multi-purpose tool that provides dark adaptation for the sample (required for the measurement of maximum photochemical efficiency), defines the measurement area on the sample, and prevents ambient light leakage into the highly sensitive photodiode used by the instrument for chlorophyll fluorescence detection.

Product Features
- Ultra-portable chlorophyll fluorometer
- Rapid screening capability with single button operation & storage of up to 200 full data sets
- Automatic calculation of parameters including Fv/Fm & OJIP analysis
- Robust enclosure with sealed, high intensity optics
- 100kHz sampling frequency with 16bit resolution
- Bluetooth wireless data transfer as standard
- Powerful Windows® data transfer & analysis software included
Handy PEA +

Handy PEA Plus is a compact, highly portable continuous-excitation type chlorophyll fluorescence analyzer. The rugged yet lightweight design makes Handy PEA Plus particularly suitable for rapid, large-scale screening of samples in the field or greenhouse in both research and teaching applications.
More
Handy PEA+ consists of a compact, lightweight control unit encapsulating sophisticated electronics. This provides the high-time resolution which is essential in performing measurements of fast chlorophyll fluorescence induction kinetics.
Simple to configure and operate, basic measurement functionality can be defined directly on the Handy PEA+. More complex experimental design may be achieved using the Protocol Editor feature which allows up to 5 user-defined protocols to be stored in memory for different field applications. Protocols are written using a custom Windows® software package, PEA+ (supplied). A tactile keypad allows selections and inputs to be made and an LCD display module presents menu options and data.
The sensor unit consists of an array of 3 ultra-bright red LEDs which are optically filtered to a peak wavelength of 650 nm (which is readily absorbed by chlorophyll) at a maximum intensity of up to 3,500 µmol m-2 s-1 at the sample surface. The LEDs are focused via lenses onto the leaf surface to provide uniform illumination over the area of leaf exposed by the leafclip (4mm dia). An optical feedback circuit monitors and corrects changes in the output intensity of the LEDs which can be caused by internal heat build-up within the LEDs themselves. The circuit also compensates for intensity changes caused by variation in ambient temperature.
The sensor unit is fitted with a high-performance PIN photodiode. Optical design and filtering ensure that it responds maximally to the longer wavelength fluorescence signal and blocks the reflected shorter wavelength LED light used as the source of illumination. Variable-rate analysis allows fluorescence signals to be sampled at different acquisition rates throughout the different phases of the induction kinetic. Initially, data is sampled at 10 µsecond intervals for the first 300 µseconds with subsequent induction phases recorded at lower sample rates as the rate of kinetic activity reduces.
Up to 1,000 recordings of between 0.1 seconds – 300 seconds may be saved in the onboard memory of the Handy PEA+. Calculated parameters may be viewed onscreen with more comprehensive data display achieved by transferring saved data via USB to a PC where the supplied PEA+ Windows® software allows a variety of numerical and graphical presentation options.
Interested to learn how to interpret fast chlorophyll fluorescence induction curves?
Product Features
- Compact (170 x 85 x 40mm), lightweight (565gms)
- Large-scale screening capacity up to 1000 full trace data files
- High time resolution detection for discrimination of fast chlorophyll fluorescence induction kinetics
- Saturating high intensity focused LED array for accurate determination of Fmax
- Upload user-defined, repeatable protocols for automatic field execution
- Interchangeable sensor unit cables with lengths of up to 20 meters
- Powerful Windows® data transfer & analysis software included
Application Note

Rapid Light Curves using Handy PEA+
Rapid Light Curves (RLCs) have been used in photosynthesis research since the late 1990s, and are typically measured using Pulse Amplitude Modulation (PAM) fluorometers. This novel functionality allows Handy PEA+ users to extend the range of analysis protocols available to include a measurement technique not typically associated with this type of instrument. Better still, measurement of RLCs can be performed straight out of the box with no updates or modifications to the system necessary!

The application note is supplied with a pre-configured Handy PEA+ protocol that can be uploaded directly to your Handy PEA+ instrument. A custom Microsoft Excel® template to perform the graphical and statistical analysis required to interpret RLC data is included in the download; full guidelines on the use of the protocol and template are included within the application note itself.
OJIP Parameters
Time Marks Parameters
The PEA Plus and M-PEA Plus software packages extract chlorophyll fluorescence values from the recorded data from Handy PEA, Pocket PEA and M-PEA chlorophyll fluorimeters at 5 pre-defined Time Marks. The times are:
- T1 = 50 microseconds
- T2 = 100 microseconds
- T3 = (K step) 300 microseconds
- T4 = (J step) 2 milliseconds
- T5 = (I step) 30 milliseconds
Chlorophyll fluorescence values at these Time Marks are used to derive a series of further biophysical parameters, all referring to time base 0 (onset of fluorescence induction), that quantifies the photosystem II behavior for (A) The specific energy fluxes (per reaction center) for:
- Absorption (Abs/RC)
- Trapping (TRo/RC)
- Dissipation (DIo/CS)
- Electron transport (ETo/RC)
and (B) the flux ratios or yields:
- Maximum yield of primary photochemistry (ΦEo = TRo/ABS)
- Efficiency (ψo=Eto/Tro) with which a trapped exciton can move an electron into the electron transport chain further than QA
- Quantum yield of electron transport (Eto/CS)
The concentration of active PSII reaction centers per excited cross section (RC/CS) is also calculated.
Performance Index Parameters (OJIP Analysis)
The Performance Index is essentially an indicator of sample vitality. It is an overall expression indicating a kind of internal force of the sample to resist constraints from outside. It is a Force in the same way that redox potential in a mixture of redox couples is a force. Exactly the PI is a force if used on log scale. Therefore we say:
log PI = Driving Force DF
The PI or Performance Index is derived according to the Nernst equation. It is the equation which describes the forces of redox reactions and generally movements of Gibbs free Energy in biochemical systems. Such a force (or potential = force) is defined as:-
Potential = log x/(1-x)
where x is the fraction of a partner in the reaction A to B. Therefore:
X = A /(A + B)
and if you now convert to:
X/(1-X) = A / B
or for redox reactions
log (red)/(ox)
Now the total potential in a mixture is the sum of the individual potentials or:
Potential total = log X1/(1-X1) + log X2/(1-X2) ….etc
In our case PI (on an absorption basis or on a chlorophyll basis) has three components:
The first component shows the force due to the concentration of active reaction centers
X1 = RC Chlorophyll per total chlorophyll = CHL(RC)/CHL(total)
therefore:
X1/(1-X1) = CHL(RC) / ( CHL(tot) – CHL(RC)) = CHL(RC) / CHL(antenna) = RC/ABS
RC/ABS is a parameter of the JIP test and it is related to the force generated by the RC concentration per antenna chlorophyll.
The second component is the force of the light reactions, which is related to the quantum yield of primary photochemistry:
PHI(Po) = maxTrapping / Absorption = TRo/ABS = Fv/Fm
The Driving force of the light reactions is therefore:
DF(PHI(Po)) = log PHI/(1 – PHI) = log (Fv/Fm) / ( 1 – Fv/Fm) = log Fv/Fo = log kP/kN
The third component is the force related to the dark reactions (after Qa-). These are normal redox reactions in the dark.Expressed by the JIP-test as:
psi(o) = ETo/TRo = (1 – Vj)
Where Vj = relative variable fluorescence at 2 ms or at the step J therefore:
Vj = (Fj – Fo)/(Fm – Fo) and psi(o) = 1 – Vj = (Fm – Fj) / (Fm – Fo)
Therefore the force of the dark reactions is:
DF(psi) = log psi/(1-psi) = log (1-Vj)/Vj
Now all three components together make:
DF (total~on~a~chl~basis) = DF(RC) + DF(phi) + DF(psi)
or without log
PI(abs) = RC/ABS x PHI/(1-PHI) x psi/(1-psi)
or in fluorescence terms:
PI(abs) = ((dV/dto)/Vj) x Fm/Fv x (Fv/Fo) x (Fm-Fj)/(Fj-Fo)
Additional Resources
A more detailed derivation and explanation is beyond the scope and intention of this web page. Further detailed information may be obtained from the following publications which may be downloaded as PDF documents from the following links.
R.J. Strasser, A. Srivastava and M. Tsimilli-Michael
The fluorescence transient as a tool to characterize and screen photosynthetic samples.
Strasser, R.J., M. Tsimilli-Michael and Srivastava, A.
Analysis of the Fluorescence Transient.
M-PEA

The M-PEA (Multi-Function Plant Efficiency Analyzer) combines high-quality fast fluorescence kinetic and P700+ absorbance studies with ground-breaking Delayed Fluorescence (DF) measurements providing one of the most comprehensive systems for the investigation of plant photosynthetic efficiency available.

Screenshot demonstrating prompt fluorescence and P700+ absorbance

Screenshot demonstrating delayed fluorescence
Product Features
- Advanced lab-based system for investigation of plant photosynthetic efficiency.
- M-PEA-1 variant for prompt fluorescence and P700+ modulated absorbance measurements.
- M-PEA-2 variant as M-PEA-1 with additional measurements of delayed fluorescence and leaf absorbtivity.
- Sophisticated sensor unit with all optical emitters and detectors in robust, enclosed housing.
- USB connection to a Windows® PC.
- Comprehensive Windows® experimental design, data transfer and analysis software.
Application Note

Rapid Light Curves using M-PEA
Rapid Light Curves (RLCs) have been used in photosynthesis research since the late 1990s, and are typically measured using Pulse Amplitude Modulation (PAM) fluorometers. This novel functionality allows M-PEA users to extend the range of analysis protocols available to include a measurement technique not typically associated with this type of instrument. Better still, measurement of RLCs can be performed straight out of the box with no updates or modifications to the system necessary!
The application note is supplied with a pre-configured M-PEA protocol that can be uploaded directly to your M-PEA instrument. A custom Microsoft Excel® template to perform the graphical and statistical analysis required to interpret RLC data is included in the download; full guidelines on the use of the protocol and template are included within the application note itself.
Pulse Modulated Fluorometers
What are pulse-modulated chlorophyll fluorometers?
A modulated chlorophyll fluorometer uses sophisticated electronics to separate chlorophyll fluorescence from ambient light. The systems achieve this using a rapid pulsing excitation light in order to induce a corresponding pulsed fluorescence emission. The fluorometer uses a highly sensitive photodiode to detect and record the pulsed fluorescence signal and to ignore any non-pulsed signal.
NEW! FMS-300
Pulse Amplitude Modulated (PAM) chlorophyll fluorometer for teaching & research

The FMS-300 is a state-of-the-art, Pulse Amplitude Modulated (PAM) chlorophyll fluorometer combining the usability of a teaching system with the power and functionality to provide high-level research-grade data.


Key features of the FMS-300 are as follows:
- Versatile functionality:
Suitable for both teaching and research applications. FMS-300 can demonstrate complex concepts, conduct experiments, collect data, analyze results, and facilitate collaborative learning or research projects. - Fast & slow fluorescence data:
Presents fast and slow fluorescence data with equal emphasis. Fast fluorescence kinetics are captured during every saturating pulse for both dark- and light-adapted sample states, presenting opportunities for novel research. - Comprehensive parameter display:
Parameter sets relevant to the selected routine are calculated for each saturating pulse. For dark-adapted samples, OJIP parameters and parameters such as Fv/Fm are calculated. Light-adapted parameters including ETR, ΦPSII, Lake, and Puddle models for non-photochemical quenching, and both a calculated Fo’ and Fo’ measured under far-red light are calculated where appropriate. - Developed for high performance:
A measuring pulse width of 400 ns from a dedicated LED allows greater intensities to be implemented yielding a strong, low-noise signal. Measuring pulse intensity can be defined between *0.001 – 0.1 µmol m-2 s-1. Actinic and saturating pulse intensities of up to 3,000 and **20,000 µmol m-2 s-1 respectively can be delivered at the sample surface. - Streamlined data capture:
FluoroControl software provides 6 pre-set experimental routines, which can be further configured if required. This enables rapid learning and efficient, hassle-free data acquisition. - Intuitive software with a simplified control set:
Developed from the ground up with simplicity in mind. A user-friendly interface with a minimal learning curve allows easy navigation of the different functions and options. - Data visualisation & analysis:
The measuring LED performance means that 100% raw data is presented with no requirement to damp or average. Robust data visualization, analysis, and export tools allow users to interpret and present findings effectively. Valuable for both teaching complex concepts and conducting in-depth analysis in research applications. - Measuring light & actinic/saturating LED colors:
4 variants with different pairings of LED color. Supplied with either blue/blue (455 nm), red/red (624 nm), blue/white or red/white measuring/actinic and saturating LEDs. All variants contain a far-red LED (730 nm) for determination of Fo’ during the quenching analysis routine.
Product Features
- Versatile functionality
- Fast & slow fluorescence data for every saturating flash event
- Comprehensive parameter display
- Developed for high performance
- Streamlined data capture
- Intuitive but powerful software
- Data visualization & analysis
- Measuring light & actinic/saturating LED colors

FMS2+

The FMS2+ is a field portable pulse modulated chlorophyll fluorometer. The system is highly portable and fully self-contained. A system of field interchangeable batteries provides power for a full day of fieldwork. A multi-charger system allows full recharge of the batteries overnight.
The FMS2+ control box now features a white LED lamp for actinic and saturation pulse intensities. It is fitted with a USB port to allow for simple connection to modern Windows® based computers (eliminating the need to use Serial to USB converter).
For information on the use of the FMS2+ with the CIRAS for simultaneous leaf gas exchange and chlorophyll fluorescence measurements, contact PP Systems.
Product Features
- Pulse modulated system
- Compact field design
- Temperature compensated electronics
- Programmable by Hansatech Scripting Language (HSL)
- Leaf-clip with integral PAR/temperature sensor
- Field swappable battery system
- Windows® data acquisition & data analysis software